More Shows, Less Money Per Show
The top 100 tours grossed a record $3.16 billion at mid-year, but average gross per show fell to $1.63 million and show count jumped 18.2 percent. More load-ins at the same rate card, and the truck line is the one cost a production actually controls.

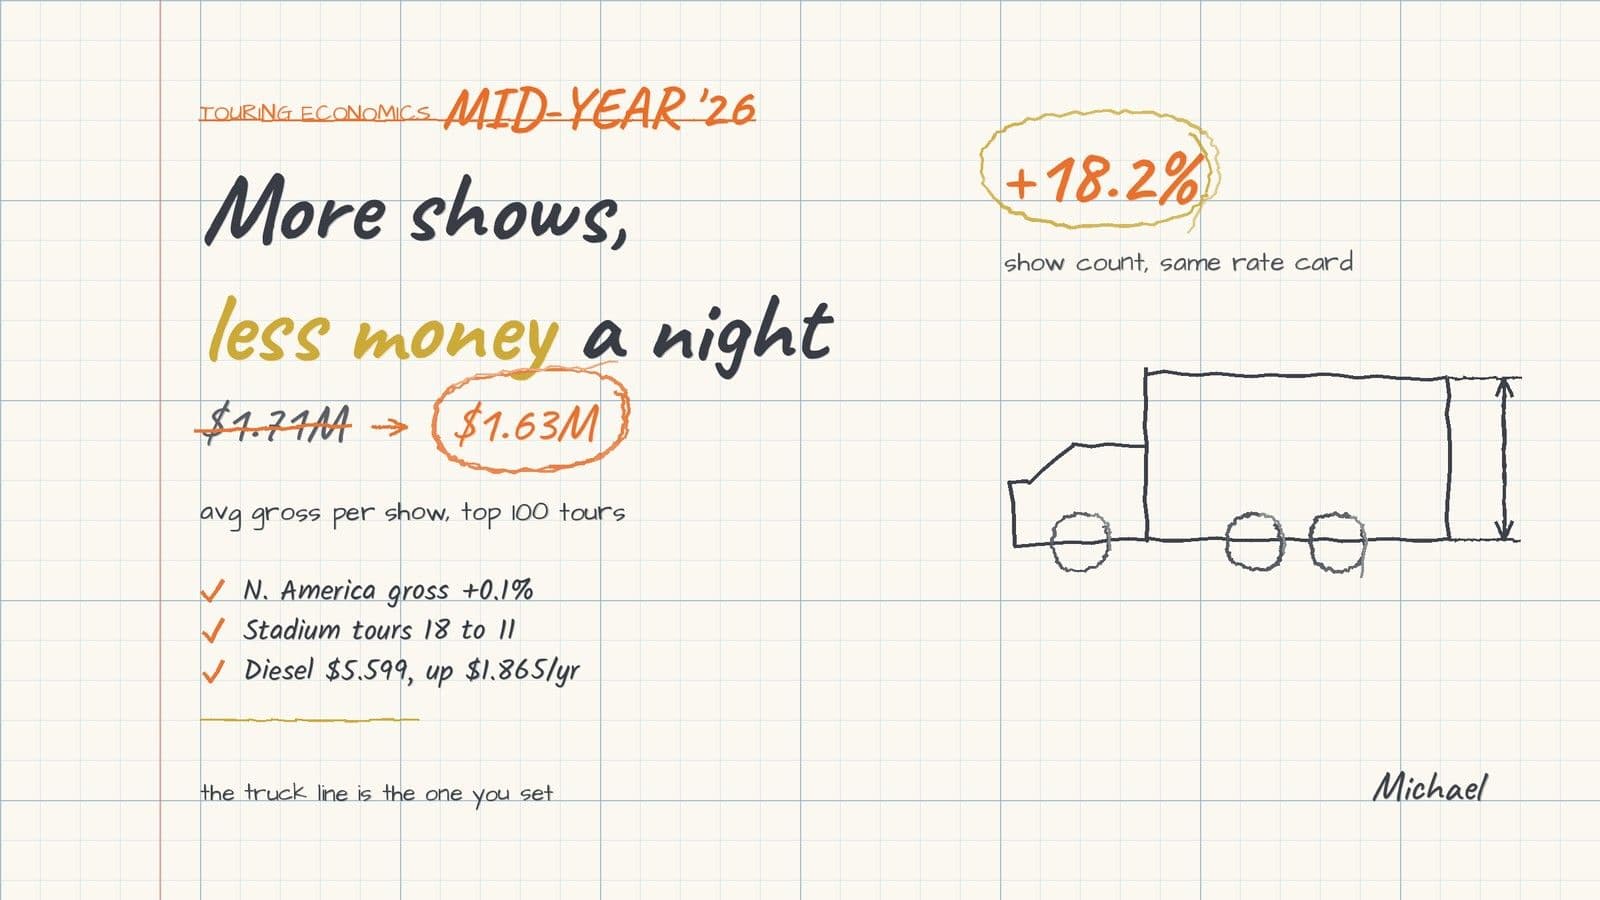
The mid-year touring numbers look like a victory lap until you divide them. Pollstar's mid-year business analysis has the top 100 worldwide tours at a record $3.16 billion, up 12.3 percent over 2025, on 26,347,656 tickets. Every headline off that report led with the record. The line under it is the one that matters if you build the budget: average gross per show fell to $1.63 million from $1.71 million, average tickets per show slid from 14,229 to 13,574, and the average ticket price barely moved at $119.92.
That combination only resolves one way. The record came from adding dates, not from bigger nights. Show count at the top 100 level was up 18.2 percent year over year. The industry grossed more money by playing more shows at slightly lower per-show numbers, which is a completely different business than growing.
North America is the harder read
The global figure is carried by markets outside the US. North American gross came in at $1.923 billion, up 0.1 percent. Flat. Tickets were up 2.5 percent, show count was up 8.6 percent, and average gross per show dropped 7.8 percent to $1,141,221 with the average ticket price down to $122.15. Stadium tours went from 18 at mid-year 2025 to 11 this year, so the biggest, most efficient revenue nights got scarcer while the calendar got fuller.
For anyone downstream of the artist, that is not an abstraction. More shows at flat total revenue means more load-ins, more load-outs, more truck moves and more sub-rental fills against essentially the same rate card as last year. The work went up. The money did not.
The cost side did not hold still
Ticket prices are flat and inputs are not. On-highway diesel averaged $5.599 a gallon for the week ending August 31, against $3.734 the same week last year, per the EIA's weekly update. That is $1.865 a gallon on every mile of the routing. Trucking has run roughly 25 to 40 percent above 2019 rates and only compressed modestly, while hotel blocks in major markets sit 30 to 50 percent over 2019. Rigging inspections, insurance and rental rates have all climbed on top of that.
Run that against a flat ticket price and the math gets ugly fast. A 3 to 5 percent bump in production cost with no offsetting revenue turns a marginal show into a break-even show and a break-even show into a loss. Do it across 18 percent more dates and the exposure compounds.
What you actually control
Here is the part worth sitting with. Almost nothing on that cost list is negotiable from a production office. You do not set the diesel price. You do not set the ticket price, and this year it barely moved anyway. You are not going to talk a market rate on rooms, insurance or rigging inspections into a different number because your tour is tight on margin.
The truck line is the exception. The number of trailers on a run is not a market price, it is a packing outcome. It is a function of how the gear is cased, how the cases stack, what the deck plan looks like and whether anybody has actually measured the load instead of estimating it from last year's run. That is the one line where a decision made at a desk in September changes the number on the invoice in November, and it is the same decision whether diesel is $3.73 or $5.60.
The margin on a fourth truck is not the truck. It is the truck plus fuel plus a driver plus the extra crew hours on both ends of every one of those extra dates. On a run that just added 18 percent more shows, dropping one trailer is not a rounding error, it is the difference between the tour paying and the tour breaking even.
The practical version
If you are building a fall routing right now, three things are worth doing before the first load-in:
- Measure the actual cases rather than carrying forward a truck count from a prior year's version of the same production. The rig changed. The count probably should have too.
- Build the deck plan before the pack, not on the dock at 7am. Cube utilization is a planning problem and it gets solved on a screen, not with a crew standing around a ramp.
- Price the marginal truck honestly across the whole run, fuel and driver and crew hours included, and compare that to what a day of load planning costs. It is not close.
The record gross is real. So is the per-show slide underneath it. When revenue per night is falling and inputs are rising, the only lever left is the one that runs on planning rather than on price, and that is the truck.
Ready to build your load plan? Log in to Truck Packer and pack it.

